Fig. 2
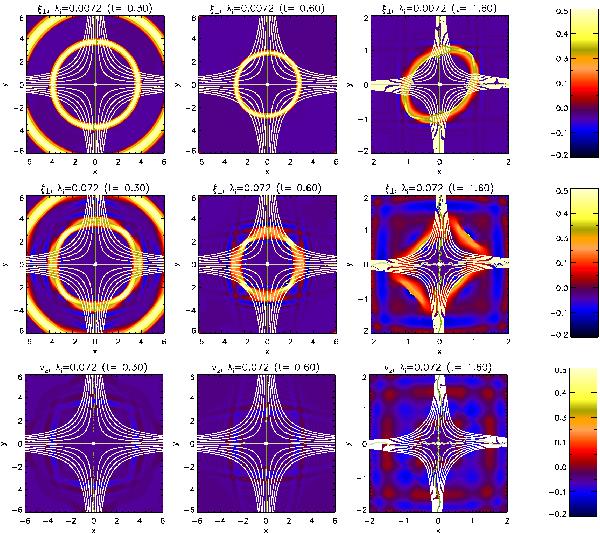
Contours of ξ ⊥ (top and middle) and vz (bottom) seen through snapshots in time, for λi = 0.0072 (top), and λi = 0.072 (middle and bottom). Each case is overplotted with selected flux surfaces (contours of Az – in white), the lines of Bx = 0 (dark green) and By = 0 (light green), and also the location of the null-point (indicated by a white star). (NB. while the first two columns display (x,y) ∈ [ − 6,6] , the final column zooms in to illustrate a range of only (x,y) ∈ [ − 2,2] of the entire simulated range, (x,y) ∈ [ − 20,20] ).
Current usage metrics show cumulative count of Article Views (full-text article views including HTML views, PDF and ePub downloads, according to the available data) and Abstracts Views on Vision4Press platform.
Data correspond to usage on the plateform after 2015. The current usage metrics is available 48-96 hours after online publication and is updated daily on week days.
Initial download of the metrics may take a while.