Fig. 10
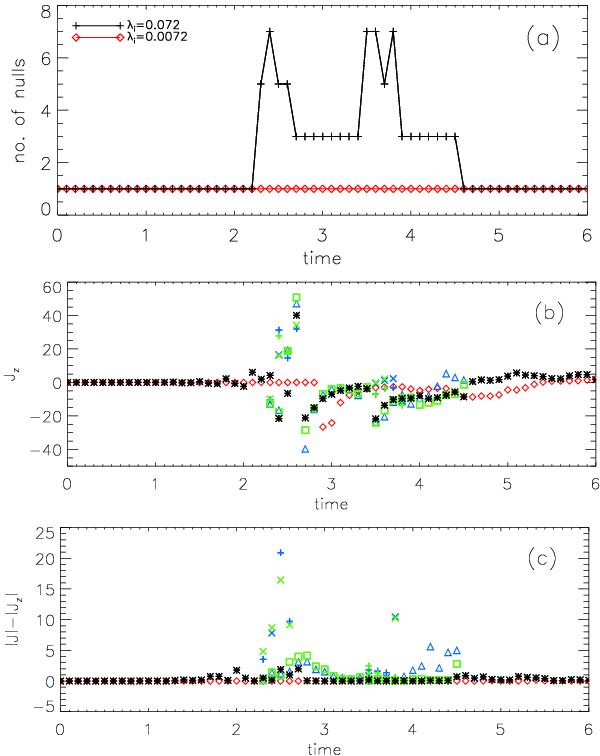
a) indicates the number of nulls present in the Hall MHD simulations. The remaining figures illustrate the evolution of current at each null; the values of b) Jz and c) | J | − | Jz | at an individual null are shown, comparing the single null case (λi = 0.0072, in red) with values at every null in the λi = 0.072 simulations. When multiple nulls are present, each null is uniquely identified by a combination of colour and symbol, identical to that outlined in Fig. 5 (e.g. 7 nulls, ordered according to location along the By = 0 line, would be identified by × + △ (in blue) ∗ (in black) □ + × (in green)).
Current usage metrics show cumulative count of Article Views (full-text article views including HTML views, PDF and ePub downloads, according to the available data) and Abstracts Views on Vision4Press platform.
Data correspond to usage on the plateform after 2015. The current usage metrics is available 48-96 hours after online publication and is updated daily on week days.
Initial download of the metrics may take a while.