Fig. 1
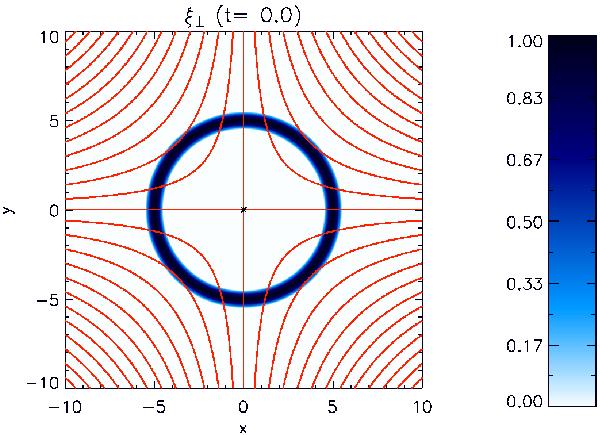
Initial fast wave annulus amplitude, defined using ξ ⊥ , centred on r = 5 with amplitude A = 1. Also overplotted are selected contours of Az (seen in red), indicating the equilibrium field configuration B = [ − x,y,0] with the X-point location indicated in white (found using the null-tracking routine of Haynes & Parnell 2007).
Current usage metrics show cumulative count of Article Views (full-text article views including HTML views, PDF and ePub downloads, according to the available data) and Abstracts Views on Vision4Press platform.
Data correspond to usage on the plateform after 2015. The current usage metrics is available 48-96 hours after online publication and is updated daily on week days.
Initial download of the metrics may take a while.