Fig. 2
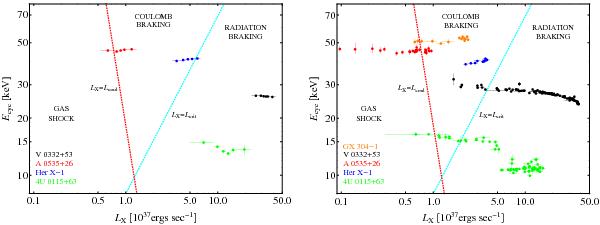
Variability of the cyclotron line energy with luminosity for different sources. The blue dashed line represents the critical luminosity, plotted by setting LX = Lcrit and Ecyc = E∗, where Lcrit is evaluated using Eq. (55). The red dashed line represents the Coulomb stopping luminosity, plotted by setting LX = Lcoul and Ecyc = E∗, where Lcoul is evaluated using Eq. (59). Left: observations on a pulse-to-pulse timescale. Right: observations on longer timescales.
Current usage metrics show cumulative count of Article Views (full-text article views including HTML views, PDF and ePub downloads, according to the available data) and Abstracts Views on Vision4Press platform.
Data correspond to usage on the plateform after 2015. The current usage metrics is available 48-96 hours after online publication and is updated daily on week days.
Initial download of the metrics may take a while.