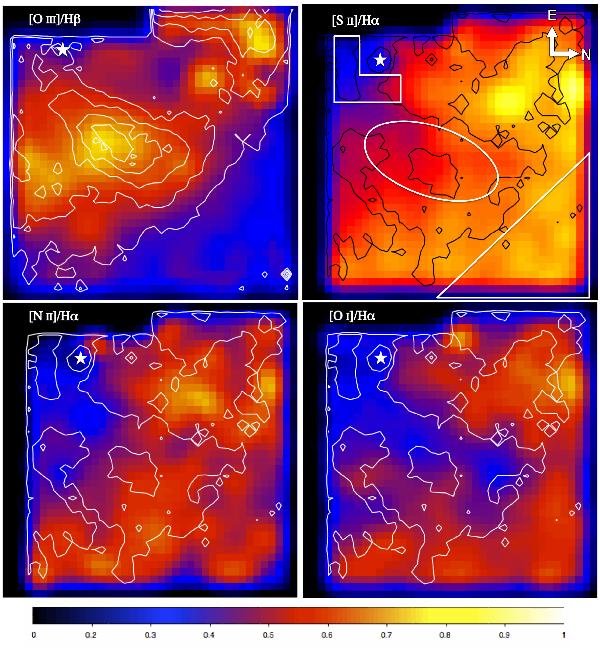
Fig. 7

Top left: ratio map of [OIII] λ5007/Hβ with the [OIII] λ5007 contours overplotted as reference and the position of CAL 83 is noted with a white star. The colour range is 0.05–6.5.Top right: ratio map of [SII] λλ6716,6731/Hα with the Hα contours overplotted. The colour range is 0.15–1.2. The white shapes show the regions from which we measured line ratios: the triangle corresponds to the faint nebula region, the oval to the central region and the L-shape to the He II region.Bottom left: ratio map of [NII] λ6583/Hα with the Hα contour overplotted. The colour range is 0.05–0.3.Bottom right: ratio map of [OI] λ6300/Hα overplotted by the Hα contours. The colour range is 0.03–0.47. The colour bar represents the normalised colour range. All maps are Gaussian-smoothed over a 3 × 3 pixel box. E is up and N is right and the FoV is 25.5′′ × 25.5′′ (7.5 × 7.5 pc2).
Current usage metrics show cumulative count of Article Views (full-text article views including HTML views, PDF and ePub downloads, according to the available data) and Abstracts Views on Vision4Press platform.
Data correspond to usage on the plateform after 2015. The current usage metrics is available 48-96 hours after online publication and is updated daily on week days.
Initial download of the metrics may take a while.


