Fig. 6
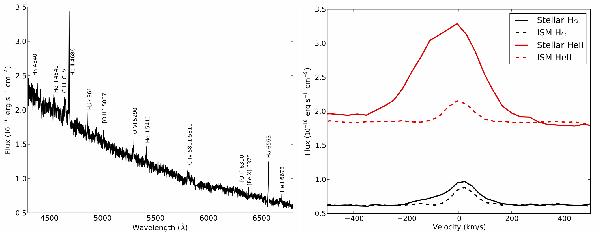
Left: CAL 83 stellar spectrum extracted from 6 spaxels that include the source. The ISM contribution has been removed and the detected emission lines are labelled.Right: a zoom on the stellar He ii and Hα line. The spectrum is plotted in velocity space, normalised to the velocity of the LMC: 270 km s-1. Shown for comparison are the ISM lines, normalised to the same area over which the stellar source extends, and taken from the area where He ii emission can actually be found (see Fig. 5). Note that the ISM emission has not been subtracted from the spectrum. The spectra are not dereddened.
Current usage metrics show cumulative count of Article Views (full-text article views including HTML views, PDF and ePub downloads, according to the available data) and Abstracts Views on Vision4Press platform.
Data correspond to usage on the plateform after 2015. The current usage metrics is available 48-96 hours after online publication and is updated daily on week days.
Initial download of the metrics may take a while.