Fig. 5
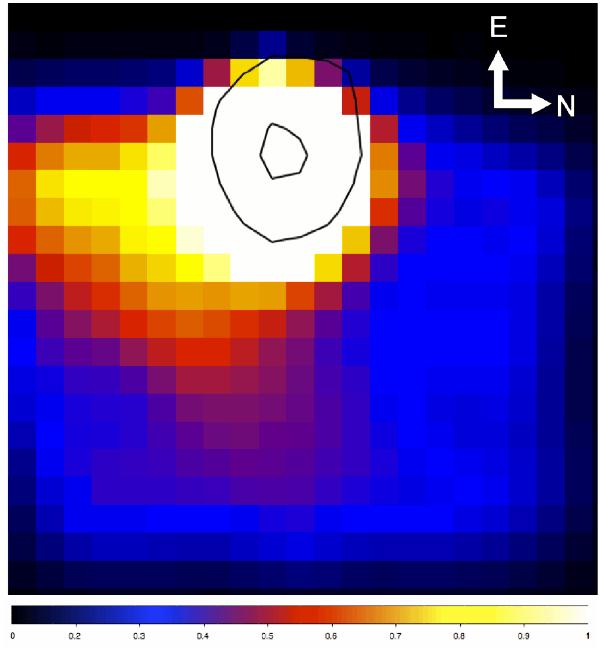
He II λ4686 flux map, Gaussian-smoothed over a 3 × 3 pixel box. Overlaid in black are the contours representing the FWHM and FWZM [deduced from the CAL 83 stellar continuum emission]. Note that we show here only one quadrant of our FoV, that where He II emission was detected. The colour ranges from 0.003 to 0.49 × 10⁻¹⁶ erg cm-2 s-1. The colour bar represents the entire normalised colour range.

Current usage metrics show cumulative count of Article Views (full-text article views including HTML views, PDF and ePub downloads, according to the available data) and Abstracts Views on Vision4Press platform.
Data correspond to usage on the plateform after 2015. The current usage metrics is available 48-96 hours after online publication and is updated daily on week days.
Initial download of the metrics may take a while.