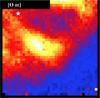
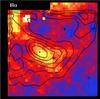
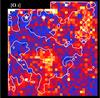
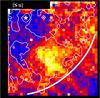
Fig. 4

Top: [O iii] map (left) and Hα map with overplotted [O iii] contours (right). The colour ranges are 0.17–0.98 for Hα and 0.19–1.85 for [O iii], in units of 10-16 erg cm-2 s-1.Bottom: [O i] λ6300 (left), and [S ii] λ6716 (right) maps, all with Hα contours overplotted. In the [SII] image we have indicated the transition region over which the [SII] over [NII] ratio increases from 2.3 to 3.5 see Sect. 4.2. The colour ranges are 0.015–0.288 for [O i] and 0.106–0.454 for [S ii], in units of 10-16 erg cm-2 s-1. Colour bar at the bottom indicates the normalised colour range. E is top and N is right, and the FoV is 25.5′′ × 25.5′′ (7.5 × 7.5 pc2). The spatial PSF is about 3 spaxels in height and 2 spaxels width.

Current usage metrics show cumulative count of Article Views (full-text article views including HTML views, PDF and ePub downloads, according to the available data) and Abstracts Views on Vision4Press platform.
Data correspond to usage on the plateform after 2015. The current usage metrics is available 48-96 hours after online publication and is updated daily on week days.
Initial download of the metrics may take a while.