Fig. 2
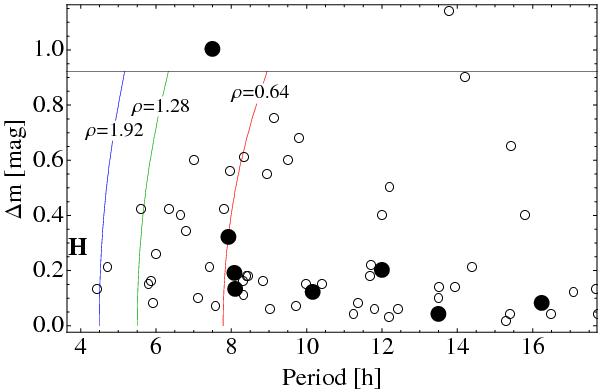
Lightcurve amplitude (Δm) as a function of the rotation period (in hours) for the TNOs in the vicinity of Haumea. Filled and open circles stand for confirmed family members and background population (from Duffard et al. 2009; Thirouin et al. 2010), respectively. The letter H shows the position of Haumea. Vertical blue, red, and green curves are the limit for stability, assuming the objects are in hydrostatic equilibrium, i.e., stable objects left of a line are denser than the number in the label (in g cm-3). Objects above the black line (Δm ~ 0.9 mag) are unstable (under the hydrostatic equilibrium assumption), and are likely contact binaries.
Current usage metrics show cumulative count of Article Views (full-text article views including HTML views, PDF and ePub downloads, according to the available data) and Abstracts Views on Vision4Press platform.
Data correspond to usage on the plateform after 2015. The current usage metrics is available 48-96 hours after online publication and is updated daily on week days.
Initial download of the metrics may take a while.