Fig. 10
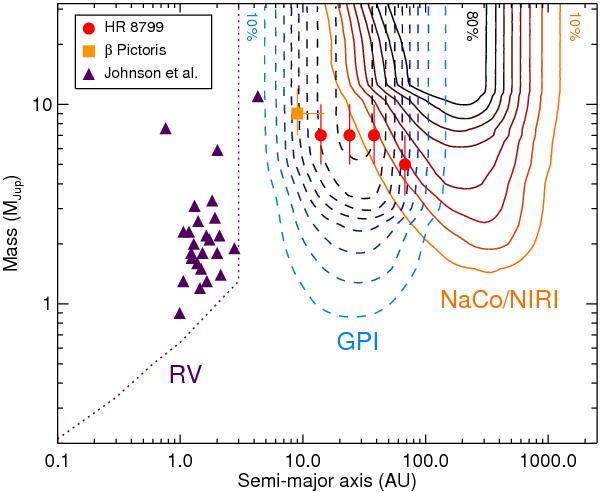
Comparison of the mean probability of detection for the present survey (plain orange contours) with a simulated survey with GPI of the same 42 targets (dashed blue contours). The mean probability of detection is obtained using Monte-Carlo simulations as described in Sect. 5.4. In addition to β Pic b (orange square) and the HR 8799 planets (red circles), the giant planets detected around old A stars by Johnson et al. (2010b, 2011) have been overplotted (purple triangles). The dotted purple line shows the median detection threshold of the Bowler et al. (2010a) RV survey around old A-type stars. The HR 8799 planets are represented at their projected physical separation because the true physical separation is not yet known precisely. Note that Fomalhaut b has not been included due to its uncertain nature (see e.g. Janson et al. 2012).
Current usage metrics show cumulative count of Article Views (full-text article views including HTML views, PDF and ePub downloads, according to the available data) and Abstracts Views on Vision4Press platform.
Data correspond to usage on the plateform after 2015. The current usage metrics is available 48-96 hours after online publication and is updated daily on week days.
Initial download of the metrics may take a while.