Fig. 6
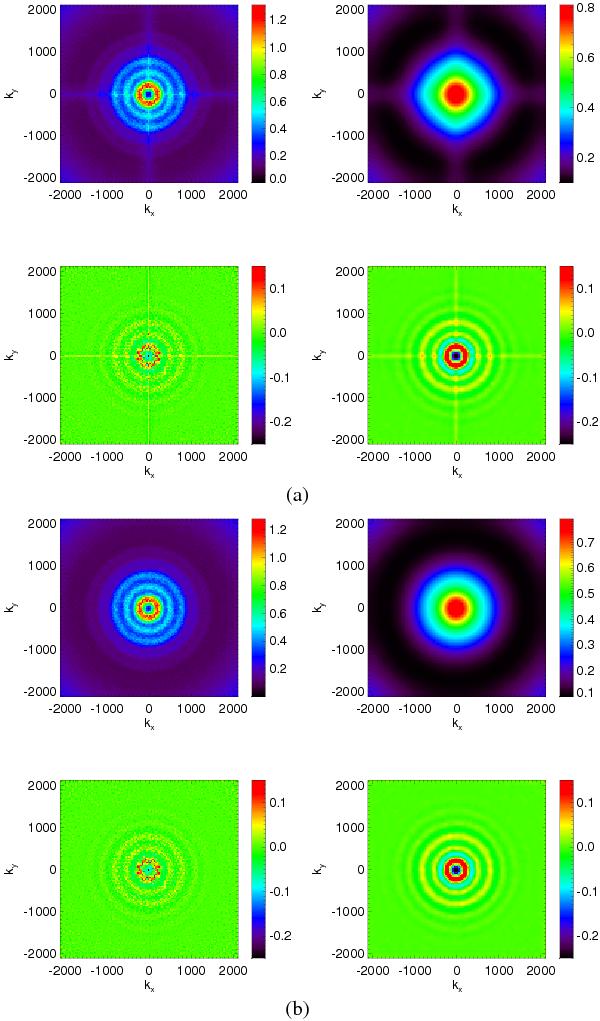
a) Bi-dimensional Fourier spectra of one of our simulation at different scales. Upper-left: mean of the squared-amplitude of the Fourier coefficients for all patches i.e. . An isotropic un-decimated wavelet transform (“a trous”, see e.g. Starck & Murtagh 2010) is applied to the image and the results for scale one and two are shown in the bottom plots. The upper-right one corresponds to the smooth component. One notices a clear leakage along the null axes. b) Same spectra but working on the prewhitened map and applying a Kaiser-Bessel K0.5 window function. The leakage along the null axis has clearly disappeared.
Current usage metrics show cumulative count of Article Views (full-text article views including HTML views, PDF and ePub downloads, according to the available data) and Abstracts Views on Vision4Press platform.
Data correspond to usage on the plateform after 2015. The current usage metrics is available 48-96 hours after online publication and is updated daily on week days.
Initial download of the metrics may take a while.