Fig. 4
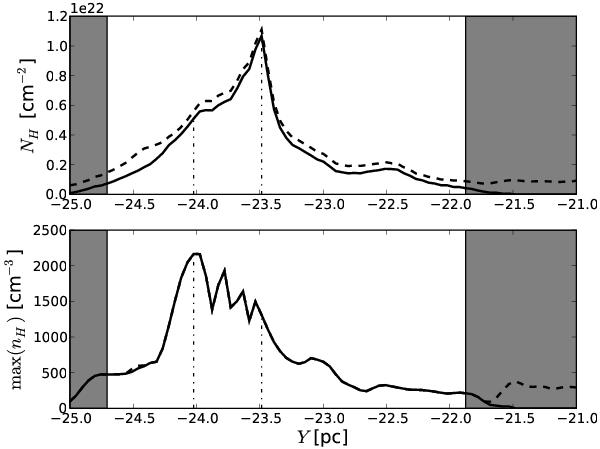
Total gas column densities along the X axis within the AB
strip under study (top plot) and maximum gas density
max(nH) on the same lines of sight (bottom
plot). Shown are the column densities over the full 50 pc lines of sight
along the X axis (dashed line) and the column densities for the
overdense regions  shown in Fig. 3 (solid line). Grey areas mark
lines of sight for which less than 50% of the mass is in the overdense region. The
dash-dotted lines mark the positions of the maxima of NH
and max(nH), which are separated by 0.55 pc.
shown in Fig. 3 (solid line). Grey areas mark
lines of sight for which less than 50% of the mass is in the overdense region. The
dash-dotted lines mark the positions of the maxima of NH
and max(nH), which are separated by 0.55 pc.
Current usage metrics show cumulative count of Article Views (full-text article views including HTML views, PDF and ePub downloads, according to the available data) and Abstracts Views on Vision4Press platform.
Data correspond to usage on the plateform after 2015. The current usage metrics is available 48-96 hours after online publication and is updated daily on week days.
Initial download of the metrics may take a while.