Fig. 3
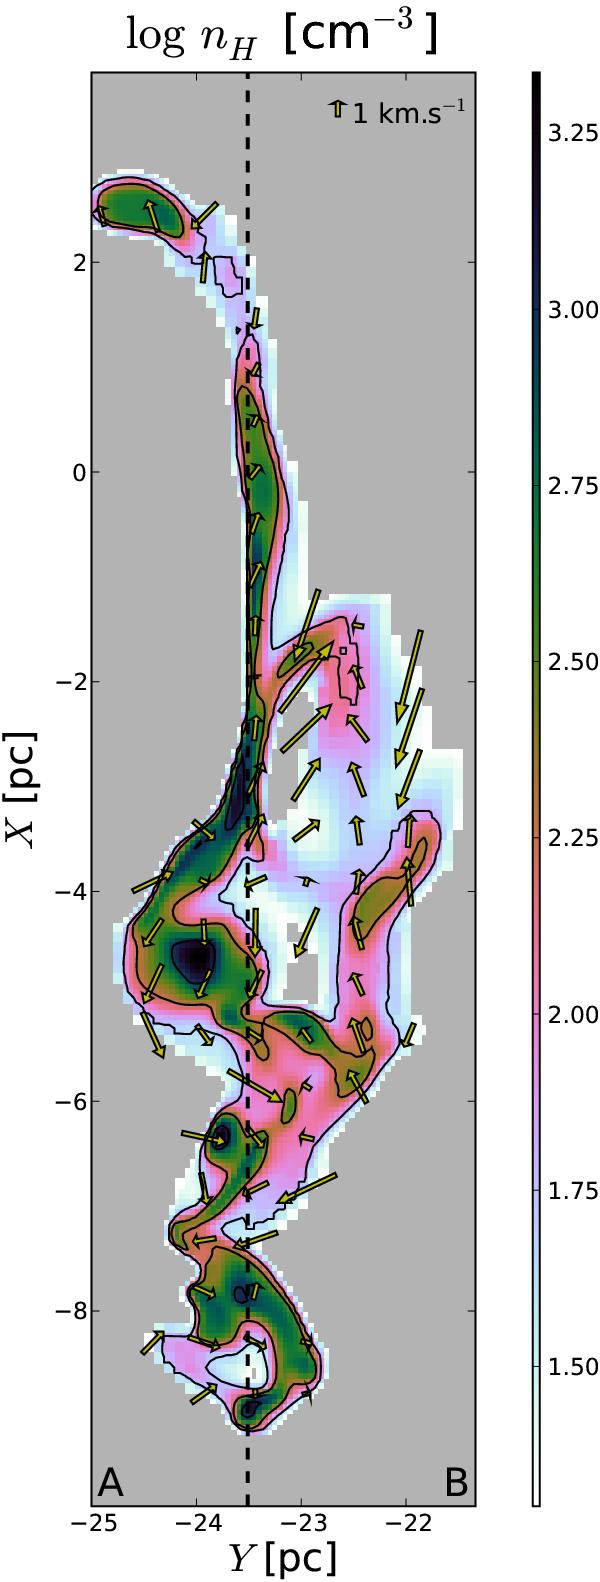
Structure of the gas in the two-dimensional slab under study. This is a close-up
view on the region X ≃ 0 in which the incoming flows of WNM collide
to form cold structures, and only regions in which
 are shown. The colour image shows the gas density nH in
logarithmic scale, while contours show the gas temperature
TMHD at 20 K (higher densities), 30 K and 50 K (lower
densities). The two-dimensional projection of the velocity field
(VX,VY)
is also shown as yellow arrows, the length of which indicate the velocity modulus at
that location (at the centre of each arrow). The A and B
extremities of the observational one-dimensional strip are indicated for
reference, and the dashed line marks an example location for the extracted density
profiles on which the PDR code is run (Fig. 5).
The grey areas are outside of the domain used for PDR computations.
are shown. The colour image shows the gas density nH in
logarithmic scale, while contours show the gas temperature
TMHD at 20 K (higher densities), 30 K and 50 K (lower
densities). The two-dimensional projection of the velocity field
(VX,VY)
is also shown as yellow arrows, the length of which indicate the velocity modulus at
that location (at the centre of each arrow). The A and B
extremities of the observational one-dimensional strip are indicated for
reference, and the dashed line marks an example location for the extracted density
profiles on which the PDR code is run (Fig. 5).
The grey areas are outside of the domain used for PDR computations.
Current usage metrics show cumulative count of Article Views (full-text article views including HTML views, PDF and ePub downloads, according to the available data) and Abstracts Views on Vision4Press platform.
Data correspond to usage on the plateform after 2015. The current usage metrics is available 48-96 hours after online publication and is updated daily on week days.
Initial download of the metrics may take a while.