Fig. 2
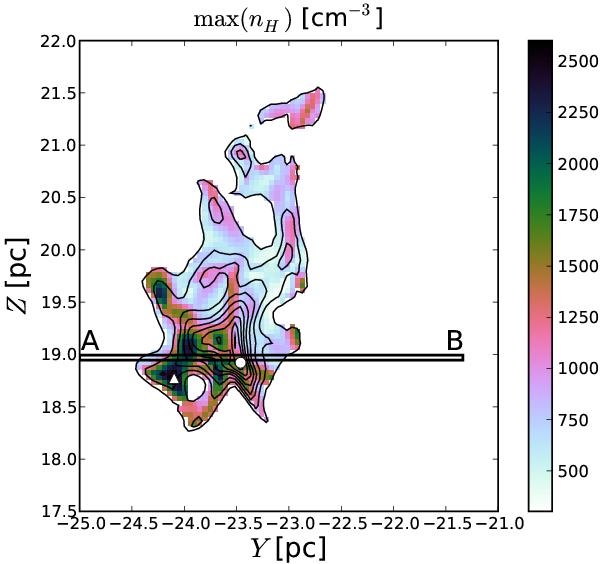
Maximum gas density nH along the lines of sight parallel to the X axis within the selected clump. Contours show the total gas column density NH from 3 × 1021 cm-2 to 1.1 × 1022 cm-2 in steps of 1021 cm-2. The “clump” displayed here has a size roughly 1.5 pc × 2.5 pc. The two-dimensional slab of gas under study is seen projected as the single-pixel-wide AB strip. The white triangle marks the position of the maximum value of max(nH) in this region, and the white circle that of the maximum of NH. They are separated by 0.65 pc.
Current usage metrics show cumulative count of Article Views (full-text article views including HTML views, PDF and ePub downloads, according to the available data) and Abstracts Views on Vision4Press platform.
Data correspond to usage on the plateform after 2015. The current usage metrics is available 48-96 hours after online publication and is updated daily on week days.
Initial download of the metrics may take a while.