Fig. 13
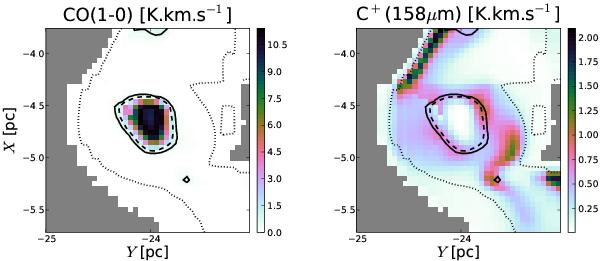
Synthetic emission maps in CO(J = 1 → 0) (left) and [CII] at 158 μm (right). The solid contour marks the assumed 0.4 K km s-1 detection threshold for CO, the dashed contour marks the position of the line centre optical depth τCO = 1, and the dotted contour marks the position of the molecular transition fH2 = 1/2. Grey areas are outside of the computational domain.
Current usage metrics show cumulative count of Article Views (full-text article views including HTML views, PDF and ePub downloads, according to the available data) and Abstracts Views on Vision4Press platform.
Data correspond to usage on the plateform after 2015. The current usage metrics is available 48-96 hours after online publication and is updated daily on week days.
Initial download of the metrics may take a while.