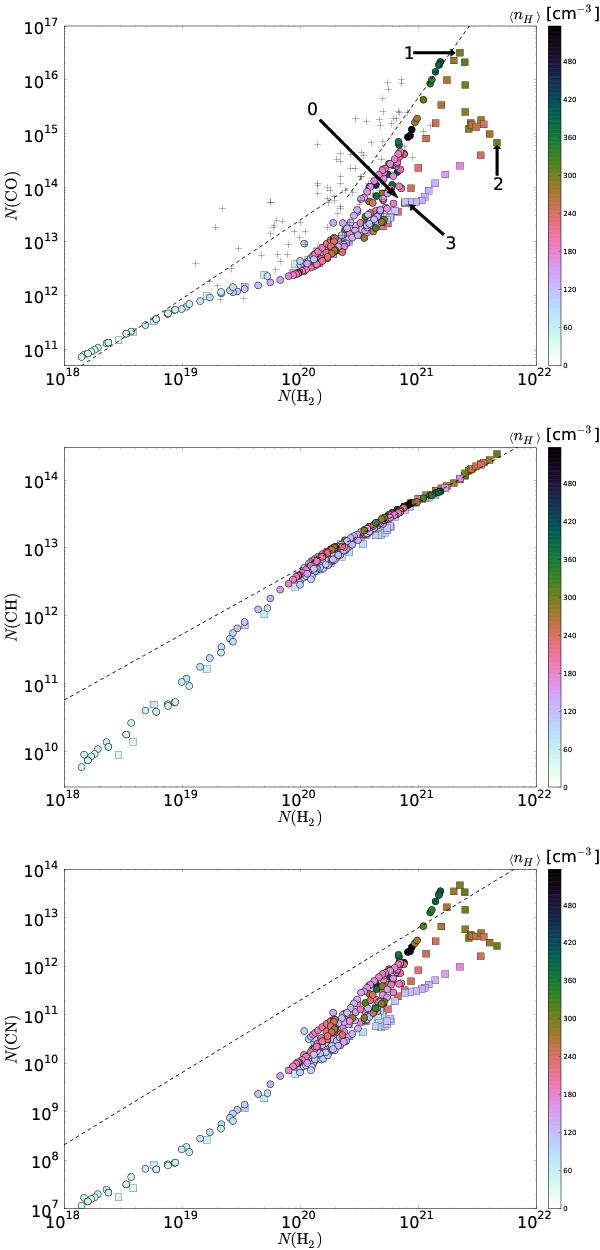
Fig. 11

Column densities of CO (top), CH (middle), and CN (bottom) versus column densities of H2, in the los models. Circles correspond to lines of sight parallel to Y and squares to lines of sight parallel to X. Their colours reflect the mean gas density ⟨nH⟩ on these lines of sight. Plus signs on the top (CO) plot stand for observational data points (Sheffer et al. 2008; Crenny & Federman 2004; Pan et al. 2005; Lacour et al. 2005; Rachford et al. 2002, 2009; Snow et al. 2008). The dashed lines are power-law fits from Sheffer et al. (2008). The lines of sight parallel to X marked 0, 1, 2, and 3 on the top panel are the same as in Figs. 7 and 8.
Current usage metrics show cumulative count of Article Views (full-text article views including HTML views, PDF and ePub downloads, according to the available data) and Abstracts Views on Vision4Press platform.
Data correspond to usage on the plateform after 2015. The current usage metrics is available 48-96 hours after online publication and is updated daily on week days.
Initial download of the metrics may take a while.


