Fig. 10
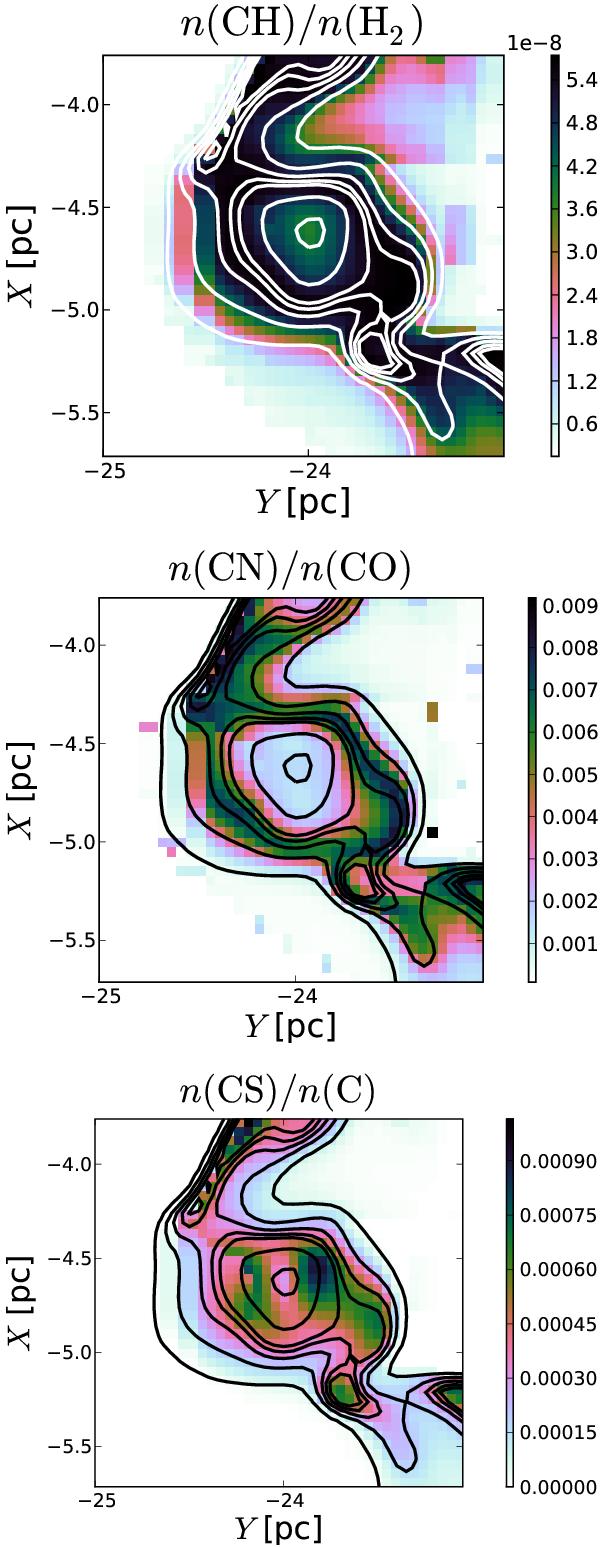
Abundance ratios n(CH)/n(H2) (top), n(CN)/n(CO) (middle), and n(CS)/n(C) (bottom) in the vicinity of the total gas density peak, located at (X ≃ −4.7 pc,Y ≃ −24 pc). Contours mark total gas densities nH of 100, 200, 300, 400, 500, 1000, and 2000 cm-3.


Current usage metrics show cumulative count of Article Views (full-text article views including HTML views, PDF and ePub downloads, according to the available data) and Abstracts Views on Vision4Press platform.
Data correspond to usage on the plateform after 2015. The current usage metrics is available 48-96 hours after online publication and is updated daily on week days.
Initial download of the metrics may take a while.