Fig. 7
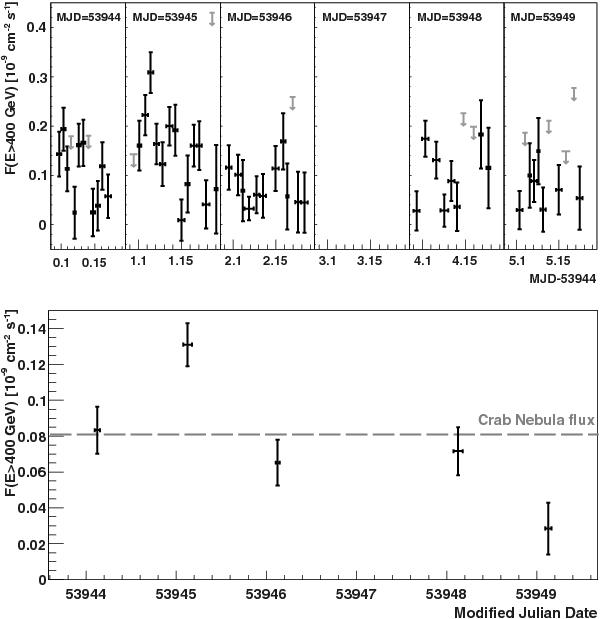
Top: MAGIC light curve for individual nights for E > 400 GeV of PKS 2155-304. Only the second night (MJD 53 945) shows significant intra-night variability. Vertical arrows represent flux upper limits at a confidence level of 95%. Bottom: light curve for the total data set for E > 400 GeV with one flux point per night. The error bars in x-direction represent the observation time. The Crab Nebula flux is shown for comparison. For more information see the text.
Current usage metrics show cumulative count of Article Views (full-text article views including HTML views, PDF and ePub downloads, according to the available data) and Abstracts Views on Vision4Press platform.
Data correspond to usage on the plateform after 2015. The current usage metrics is available 48-96 hours after online publication and is updated daily on week days.
Initial download of the metrics may take a while.