Fig. 6
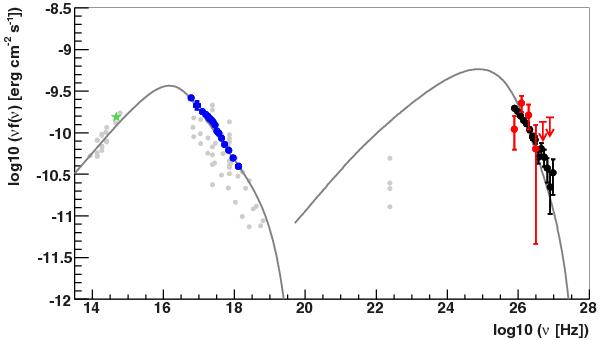
The overall spectral energy distribution (SED) of PKS 2155-304 from optical wavelengths through VHE γ-rays. The gray line denotes an SSC model as in Krawczynski et al. (2004). The effect of the EBL is taken into account by using the model of Franceschini et al. (2008). Red points: MAGIC, red arrows: MAGIC 2σ upper limits, black: H.E.S.S., blue: Chandra, green star: optical point (ROTSE). All data were taken simultaneously on the day MJD 53 946 with exception of the ROTSE point and they are taken from Aharonian et al. (2009a). Selected historical data from infrared to γ-rays are shown in gray for comparison reasons (Giommi et al. 2002).
Current usage metrics show cumulative count of Article Views (full-text article views including HTML views, PDF and ePub downloads, according to the available data) and Abstracts Views on Vision4Press platform.
Data correspond to usage on the plateform after 2015. The current usage metrics is available 48-96 hours after online publication and is updated daily on week days.
Initial download of the metrics may take a while.