Free Access
Fig. 2
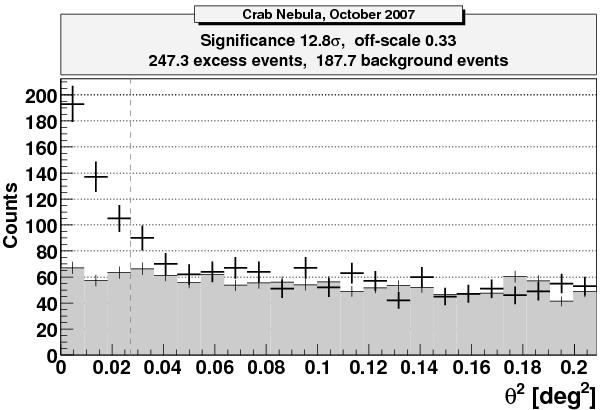
The ON-source and normalized background distribution of θ2. The ON-source is shown in the black crosses and the background is shown in the gray shaded region. 2.15 h of Crab data show an excess with a significance of 12.8σ.
Current usage metrics show cumulative count of Article Views (full-text article views including HTML views, PDF and ePub downloads, according to the available data) and Abstracts Views on Vision4Press platform.
Data correspond to usage on the plateform after 2015. The current usage metrics is available 48-96 hours after online publication and is updated daily on week days.
Initial download of the metrics may take a while.