Fig. 5
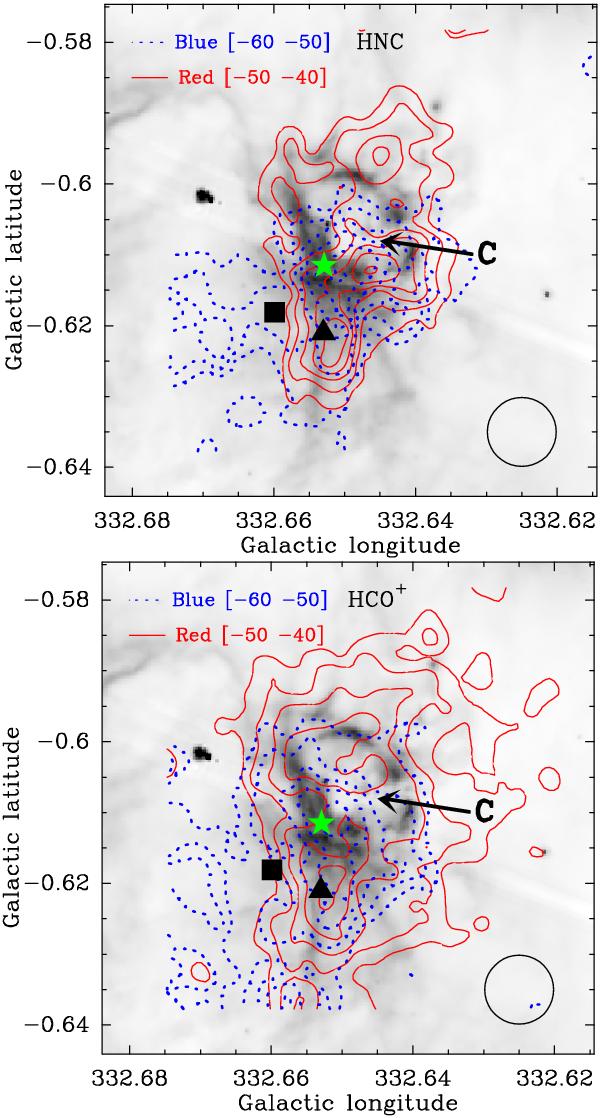
Integrated velocity contours of HNC (top panel) and HCO+ (bottom panel) emission superimposed on the GLIMPSE 8.0 μm grayscale. The contours are at multiples of 11%, 11%, 12%, and 12% level of the blue lobe of HNC, the red lobe of HNC, the blue lobe of HCO+, and the red lobe of HCO+ emission peaks, which are 9.539, 8.618, 12.861, and 10.800 K km s-1, respectively. Source C is indicated with “C” in the image. The symbols “▴”, “■” and “★” indicate the positions of the water maser, the methanol maser, and IRAS 16158-5055, respectively.
Current usage metrics show cumulative count of Article Views (full-text article views including HTML views, PDF and ePub downloads, according to the available data) and Abstracts Views on Vision4Press platform.
Data correspond to usage on the plateform after 2015. The current usage metrics is available 48-96 hours after online publication and is updated daily on week days.
Initial download of the metrics may take a while.