Fig. 4
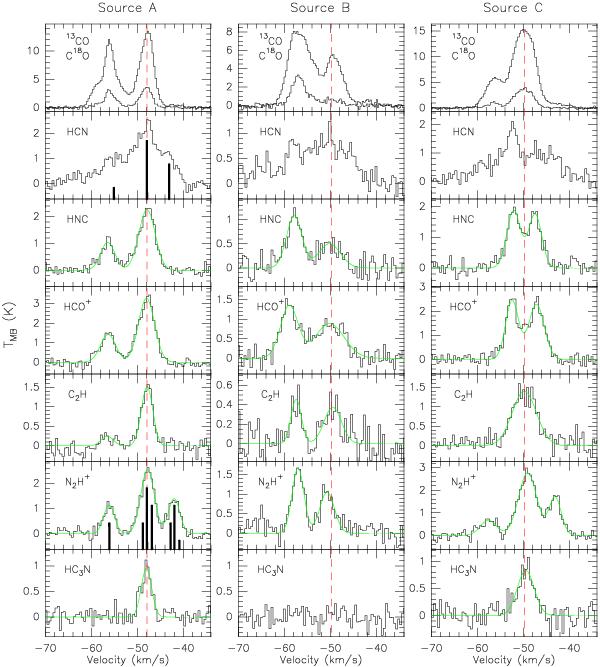
MALT90 spectra of sources A, B and C, whose positions are represented in Fig. 9 with “A” (l = 332.693, b = −0.610), “B” (l = 332.677, b = −0.619) and “C” (l = 332.645, b = −0.608), respectively. The red dashed lines indicate the peak velocities of the C18O emission. The green curves are Gauss-fit lines. HCN and N2H+ have hyperfine splitting, shown as a black bar.
Current usage metrics show cumulative count of Article Views (full-text article views including HTML views, PDF and ePub downloads, according to the available data) and Abstracts Views on Vision4Press platform.
Data correspond to usage on the plateform after 2015. The current usage metrics is available 48-96 hours after online publication and is updated daily on week days.
Initial download of the metrics may take a while.