Fig. 1
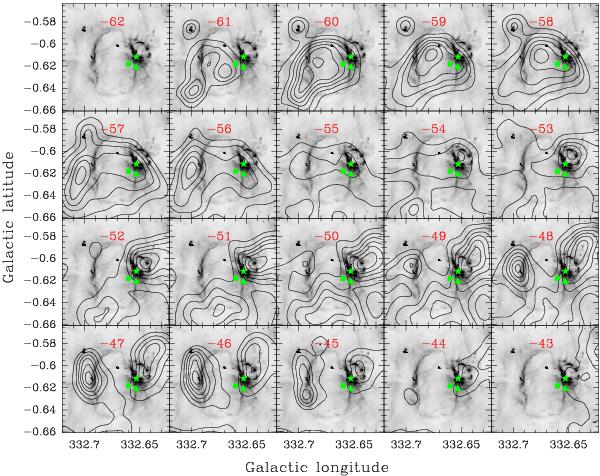
Integrated velocity contours of the 13CO emission every 1.0 km s-1 superimposed on the GLIMPSE 8.0 μm grayscale. The contours are at multiples of the 13% level of each of the emission peaks. The peak of each mosaic from −62 to −43 km s-1 is 0.718, 1.632, 3.584, 7.503, 9.191, 11.388, 14.901, 16.428, 10.915, 9.673, 12.091, 15.416, 16.916, 16.467, 14.378, 12.772, 6.043, 3.018, 1.535, and 2.631 K km s-1, respectively. The green symbols “▴”, “■” and “★” indicate the positions of the water maser, the methanol maser, and IRAS 16158-5055, respectively.
Current usage metrics show cumulative count of Article Views (full-text article views including HTML views, PDF and ePub downloads, according to the available data) and Abstracts Views on Vision4Press platform.
Data correspond to usage on the plateform after 2015. The current usage metrics is available 48-96 hours after online publication and is updated daily on week days.
Initial download of the metrics may take a while.