Free Access
Fig. 9
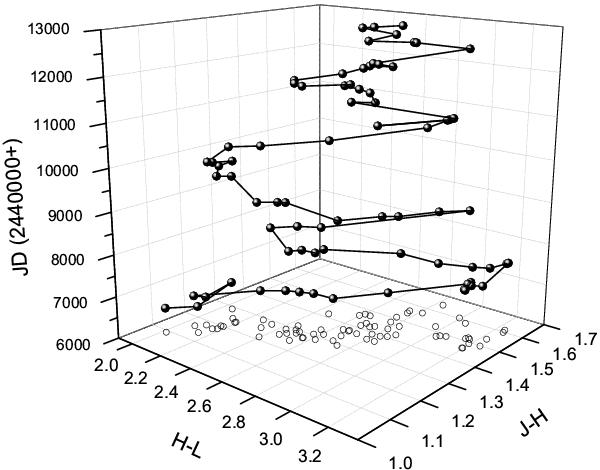
Time behaviour of J − H/H − L colour indices during the observed obscuration epoch from JD 2 446 352 to JD 2 452 960. The projections on xy planes are the same as the corresponding two-colour diagram in Fig. 8.
Current usage metrics show cumulative count of Article Views (full-text article views including HTML views, PDF and ePub downloads, according to the available data) and Abstracts Views on Vision4Press platform.
Data correspond to usage on the plateform after 2015. The current usage metrics is available 48-96 hours after online publication and is updated daily on week days.
Initial download of the metrics may take a while.