Fig. 5
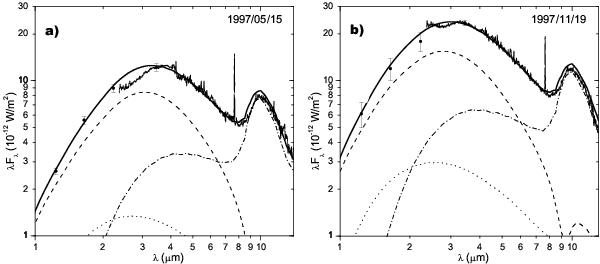
Reconstructed spectral energy distributions of RR Tel in two epochs: a) 1997/05/15 and b) 1997/11/19, differing in time by a half of the Mira pulsation period. The best-fitted DUSTY model for dust density distribution enhanced by radiatively driven winds is given by the full thick line. Observations in the near-IR are marked by four circles with their corresponding error bars for J, H, K and L wavelengths, while the ISO/SWS observations are shown by the thin full line and cover an interval from 2.3 to 13 μm. The three contributions to the model are: attenuated radiation of the Mira component (dotted line), dust scattering (dashed line), and dust emission (dot-dashed line).
Current usage metrics show cumulative count of Article Views (full-text article views including HTML views, PDF and ePub downloads, according to the available data) and Abstracts Views on Vision4Press platform.
Data correspond to usage on the plateform after 2015. The current usage metrics is available 48-96 hours after online publication and is updated daily on week days.
Initial download of the metrics may take a while.