Fig. 4
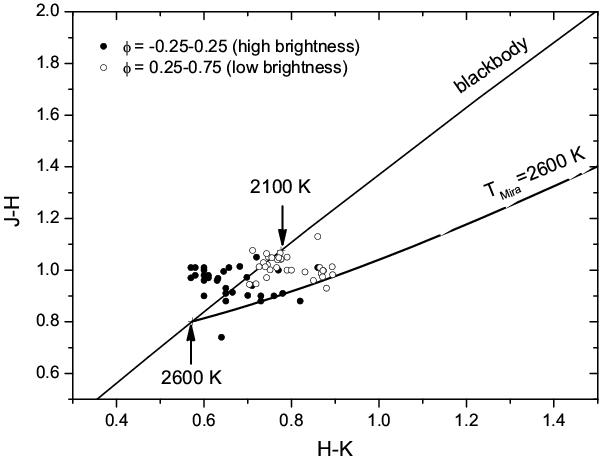
Two-colour J − H/H − K diagram with blackbody model used to determine the extreme temperature values of the Mira component in the epoch of minimum obscuration. The curve that intersects the blackbody line represents the typical dust shell model (Tdust = 1200 K) corresponding to the maximum temperature of the Mira component of 2600 K. The corresponding minimum temperature is given by the uppermost observed colour indices on the blackbody curve. Observations during the half period of high brightness (phase φ = −0.25–0.25) are given with full circles, while observations during the half period of low brightness (phase φ = 0.25–0.75) are marked by empty circles.
Current usage metrics show cumulative count of Article Views (full-text article views including HTML views, PDF and ePub downloads, according to the available data) and Abstracts Views on Vision4Press platform.
Data correspond to usage on the plateform after 2015. The current usage metrics is available 48-96 hours after online publication and is updated daily on week days.
Initial download of the metrics may take a while.