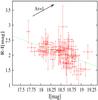
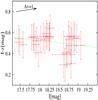
Fig. 8
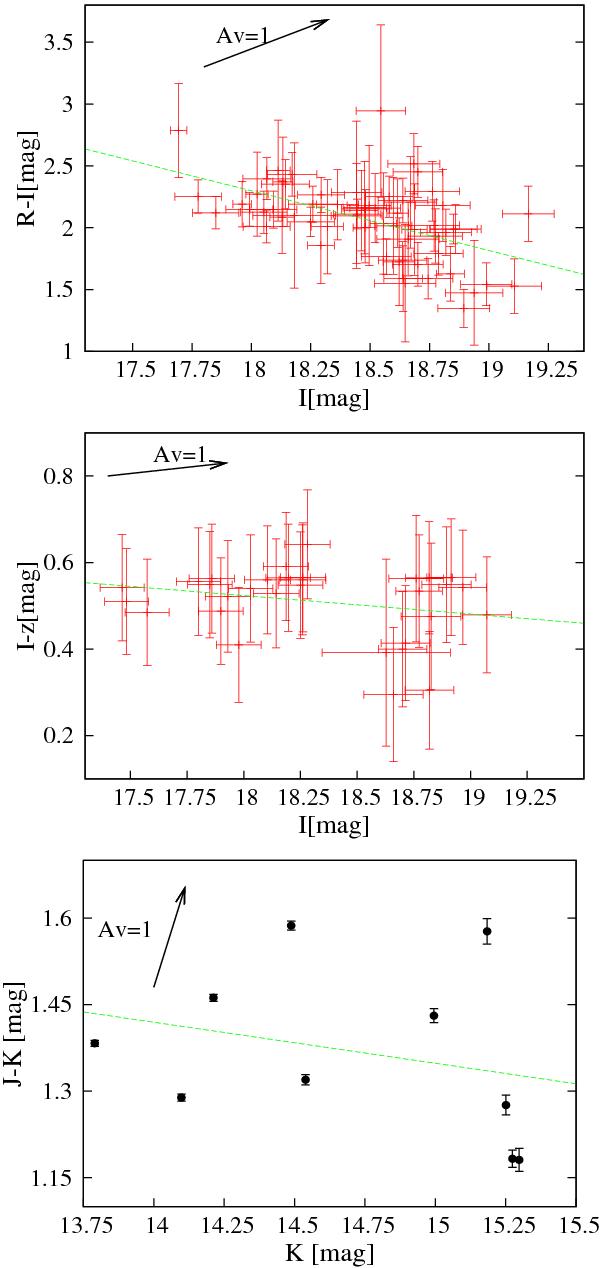
Colour–magnitude correlations for (R − I) versus I, (I − z′) versus I, and (J − Ks) versus Ks, from top to bottom, respectively. An extinction vector for Av = 1 is plotted in all cases, indicating that any variation due to variable extinction by dust particles similar to those found in the interstellar medium would cause a quite different colour magnitude correlation. The dotted lines show the least-squares fit to the data, which is not statistically significant in any of the three correlations.
Current usage metrics show cumulative count of Article Views (full-text article views including HTML views, PDF and ePub downloads, according to the available data) and Abstracts Views on Vision4Press platform.
Data correspond to usage on the plateform after 2015. The current usage metrics is available 48-96 hours after online publication and is updated daily on week days.
Initial download of the metrics may take a while.