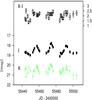
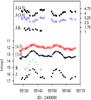
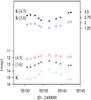
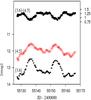
Fig. 7
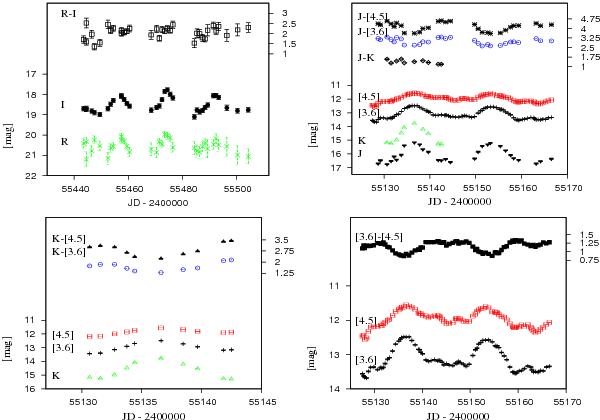
Colour and magnitude variations for two different time intervals. The top-left panel shows the variations in R − I,I, and R. The other three panels show colours and magnitudes for wavelengths up to 4.5 μm. No colour variations are evident for the R − I and J − K colours, while strong variations are visible for λ ≳ 2 μm. In these later cases the star becomes redder when becoming fainter (see also Fig. 9).
Current usage metrics show cumulative count of Article Views (full-text article views including HTML views, PDF and ePub downloads, according to the available data) and Abstracts Views on Vision4Press platform.
Data correspond to usage on the plateform after 2015. The current usage metrics is available 48-96 hours after online publication and is updated daily on week days.
Initial download of the metrics may take a while.