Fig. 5
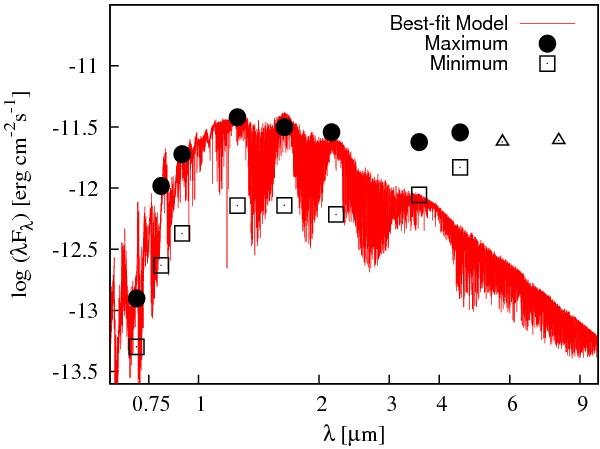
Spectral energy distribution (SED) of CHS 7797 during maximum (circles) and minimum (open squares) brightness. Open triangles show IRAC measurements at 5.6 μm and 8 μm, which are single-epoch observations taken about 3 − 4 days after maximum. The best-fitted model found by VOSA, i.e. NextGen models with Teff = 2700 K and log g = 4, is shown. Note that brightness difference between minimum and maximum decreases for λ ≳ 2 μm.
Current usage metrics show cumulative count of Article Views (full-text article views including HTML views, PDF and ePub downloads, according to the available data) and Abstracts Views on Vision4Press platform.
Data correspond to usage on the plateform after 2015. The current usage metrics is available 48-96 hours after online publication and is updated daily on week days.
Initial download of the metrics may take a while.