Free Access
Fig. 4
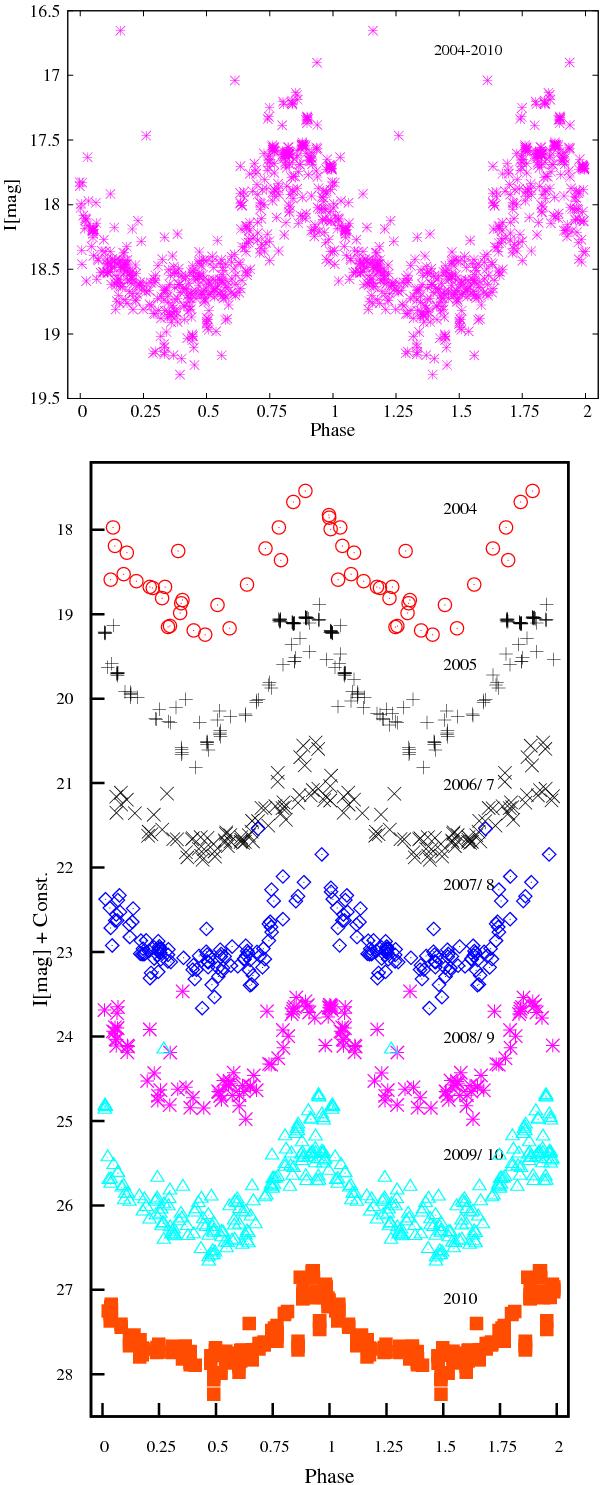
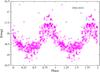
Top: light-curve of the whole I-band data set from 2004 to 2010 phased with a period of 17.8 d. Bottom: phased light-curves of the individual seven observing seasons shown with different symbols. Slight differences in the shape of these phased light-curves are visible.
This figure is made of several images, please see below:
Current usage metrics show cumulative count of Article Views (full-text article views including HTML views, PDF and ePub downloads, according to the available data) and Abstracts Views on Vision4Press platform.
Data correspond to usage on the plateform after 2015. The current usage metrics is available 48-96 hours after online publication and is updated daily on week days.
Initial download of the metrics may take a while.