Free Access
Fig. 3
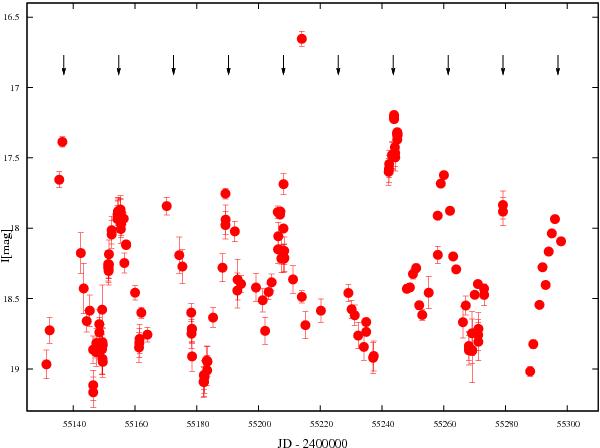
I-band light-curves for the 2009/2010 observing season during which observations were performed almost continuously over ≈ 4 months. Arrows show the observed and expected positions of the maximum light. During these season a “supermaximum” was observed at JD = 2 455 214 (see Sect. 6 for details).
Current usage metrics show cumulative count of Article Views (full-text article views including HTML views, PDF and ePub downloads, according to the available data) and Abstracts Views on Vision4Press platform.
Data correspond to usage on the plateform after 2015. The current usage metrics is available 48-96 hours after online publication and is updated daily on week days.
Initial download of the metrics may take a while.