Free Access
Fig. 3
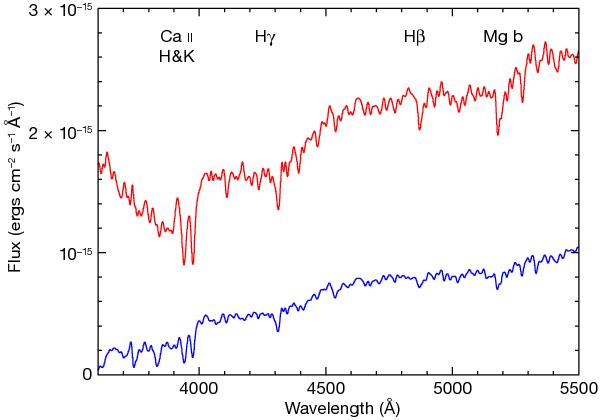
The observed spectra of the galaxy stellar continuum, summed along the whole slit but excluding the positions occupied by the PN, are shown for fields F42 (upper spectrum, in red) and F56 (lower spectrum, in blue). The strongest absorption lines are identified.
Current usage metrics show cumulative count of Article Views (full-text article views including HTML views, PDF and ePub downloads, according to the available data) and Abstracts Views on Vision4Press platform.
Data correspond to usage on the plateform after 2015. The current usage metrics is available 48-96 hours after online publication and is updated daily on week days.
Initial download of the metrics may take a while.