Fig. 6
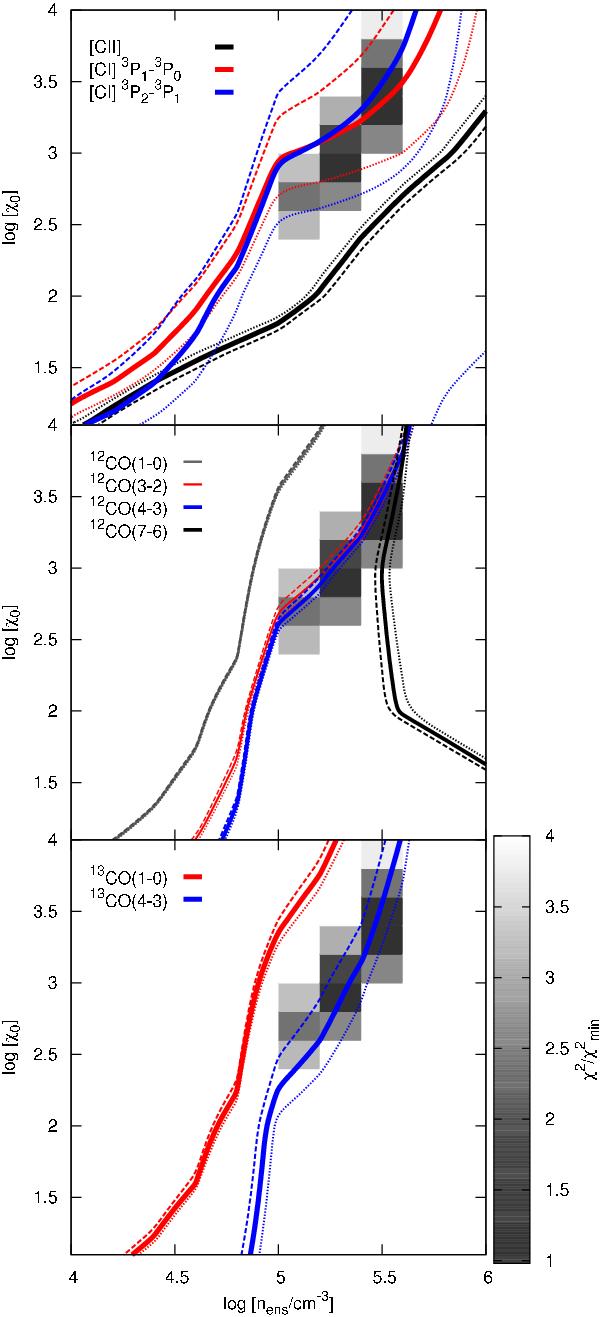
Comparison between the different observed lines with the predictions from the clumpy-PDR model for a given H2 volume density and FUV radiation field. In all panels, the solid lines represent the observed values while the dashed and dotted lines represent their lower and upper error bars, respectively. The gray-scale represents the value of χ2 relative to its minimum value,  .
.
Current usage metrics show cumulative count of Article Views (full-text article views including HTML views, PDF and ePub downloads, according to the available data) and Abstracts Views on Vision4Press platform.
Data correspond to usage on the plateform after 2015. The current usage metrics is available 48-96 hours after online publication and is updated daily on week days.
Initial download of the metrics may take a while.