Fig. 5
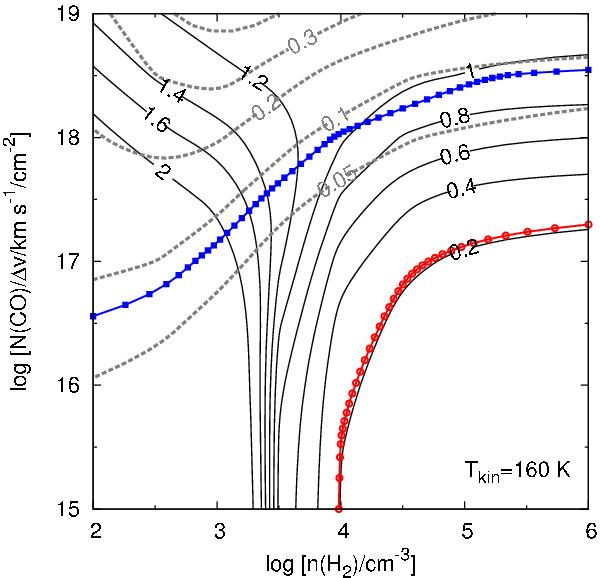
Comparison between the observations and the predictions from the radiative transfer model for the 12CO J = 1 → 0 and J = 4 → 3 line ratios (black-solid contour) and the 13CO to 12CO J = 1 → 0 line ratio (gray-dashed contour) for Tkin = 160 K. The observed 13CO to 12CO J = 1 → 0 ratio of 0.08 is shown as a blue line with boxes while the 12CO J = 1 → 0 to J = 4 → 3 ratio of 0.22 is shown as a red line with circles.
Current usage metrics show cumulative count of Article Views (full-text article views including HTML views, PDF and ePub downloads, according to the available data) and Abstracts Views on Vision4Press platform.
Data correspond to usage on the plateform after 2015. The current usage metrics is available 48-96 hours after online publication and is updated daily on week days.
Initial download of the metrics may take a while.