Fig. 1
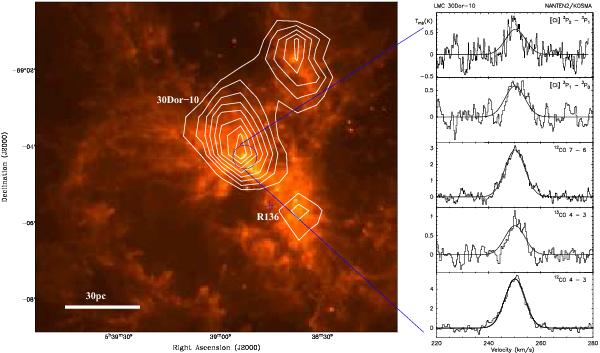
(Left panel) Spitzer 8 μm emission map of the 30 Dor region (Meixner et al. 2006) overlaid by an integrated intensity map of the 12CO J = 1 → 0 line (Wong et al. 2011). The contour levels correspond to 20% to 80% of the peak intensity (11.3 K km s-1), in steps of 10%. The angular resolution of the Spitzer 8 μm and CO maps are 2′′ and 45′′, respectively. The center of the R136 super star cluster and the NANTEN2 38′′ beam are marked by a cross and a circle, respectively. (Right panel) Observed lines and corresponding Gaussian fits.
Current usage metrics show cumulative count of Article Views (full-text article views including HTML views, PDF and ePub downloads, according to the available data) and Abstracts Views on Vision4Press platform.
Data correspond to usage on the plateform after 2015. The current usage metrics is available 48-96 hours after online publication and is updated daily on week days.
Initial download of the metrics may take a while.