Fig. 3
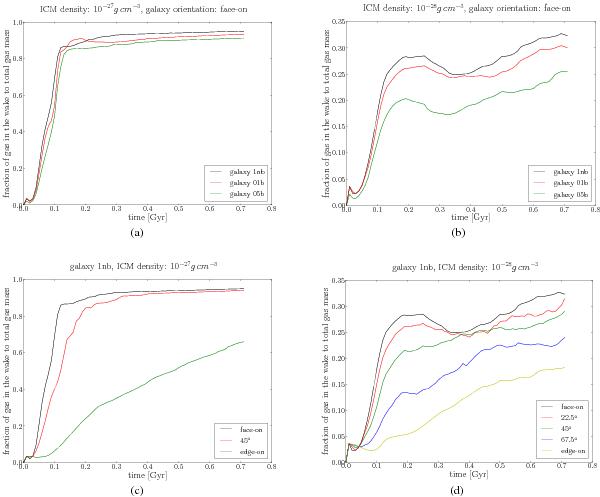
Fraction of the ISM, present in the wake of the galaxies, compared to the total amount of ISM is plotted versus simulation time. a), c) High ram pressure, b), d) low ram pressure. In a) and b), the behaviour of the different model galaxies is depicted to show the influence of a stellar bulge. In c) and d) we show the model galaxy 1nb, flying with different inclination angles with respect to the wind.

Current usage metrics show cumulative count of Article Views (full-text article views including HTML views, PDF and ePub downloads, according to the available data) and Abstracts Views on Vision4Press platform.
Data correspond to usage on the plateform after 2015. The current usage metrics is available 48-96 hours after online publication and is updated daily on week days.
Initial download of the metrics may take a while.