Free Access
Fig. 5
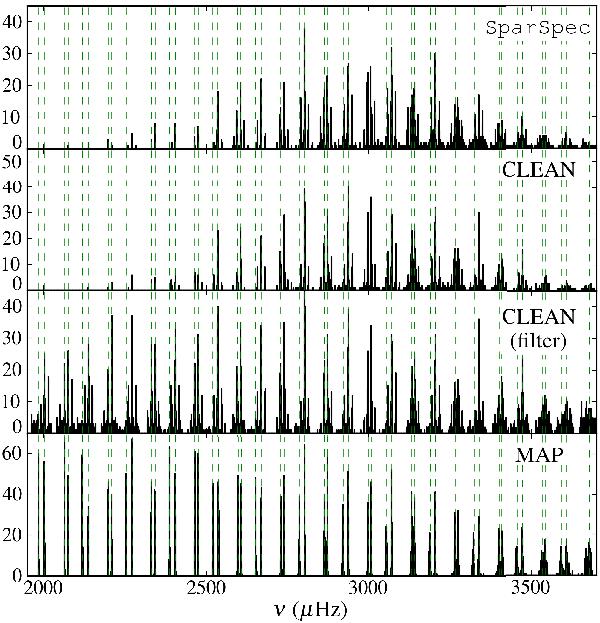
Histograms of the output frequencies from the MAP, CLEAN (with and without prior filtering) and SparSpec algorithms for 100 artificial time series. The vertical green lines mark the input frequencies to the time-series simulator.
Current usage metrics show cumulative count of Article Views (full-text article views including HTML views, PDF and ePub downloads, according to the available data) and Abstracts Views on Vision4Press platform.
Data correspond to usage on the plateform after 2015. The current usage metrics is available 48-96 hours after online publication and is updated daily on week days.
Initial download of the metrics may take a while.