Fig. 3
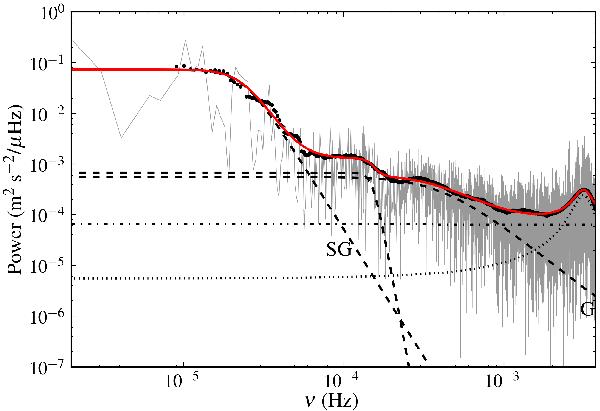
Power spectrum of the radial velocity of 18 Sco represented in logarithmic units. The contributions to the noise from granulation (G), supergranulation (SG) and from a third Harvey-like component are represented as dashed lines. The photon noise is a dot-dashed line. The p mode component of the spectrum appears as a dotted line. The full red line shows their sum. The black dots are the points of a binned power spectrum that has been effectively used to perform the fit.
Current usage metrics show cumulative count of Article Views (full-text article views including HTML views, PDF and ePub downloads, according to the available data) and Abstracts Views on Vision4Press platform.
Data correspond to usage on the plateform after 2015. The current usage metrics is available 48-96 hours after online publication and is updated daily on week days.
Initial download of the metrics may take a while.