Free Access
Fig. 2
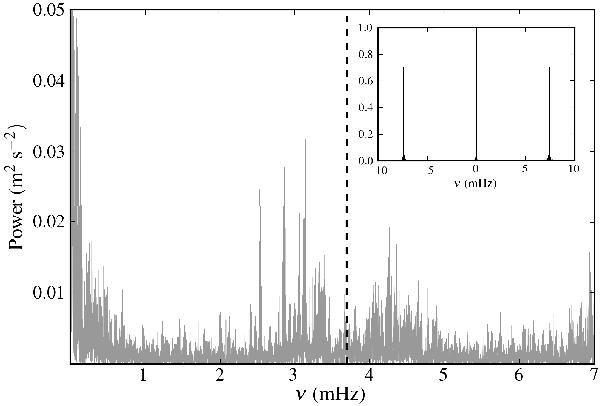
Power spectrum of the radial velocity of 18 Sco estimated using a Lomb-Scargle weighted periodogram. The vertical dashed line marks the equivalent Nyquist frequency calculated using the median exposure time. The inset shows the power spectrum of the window function w(t), normalized to its maximum.
Current usage metrics show cumulative count of Article Views (full-text article views including HTML views, PDF and ePub downloads, according to the available data) and Abstracts Views on Vision4Press platform.
Data correspond to usage on the plateform after 2015. The current usage metrics is available 48-96 hours after online publication and is updated daily on week days.
Initial download of the metrics may take a while.