Fig. 3
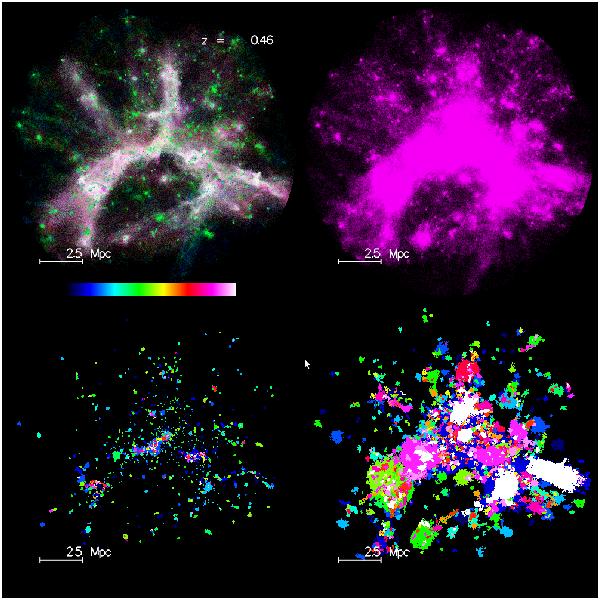
View of the third zoom level of the simulation. Top: gas (colour-coded by temperature, logarithmic scale from 800 to 1.4 × 10⁶ K), and DM (right). Bottom: structures and substructures detected by AdaptaHOP. Left: baryonic galaxies and satellites, right: DM haloes and subhaloes. Haloes and galaxies are represented in dark and bright blue and green; subhaloes and satellites in yellow, orange, magenta, red, and white. The white bar indicates the comoving length-scale.
Current usage metrics show cumulative count of Article Views (full-text article views including HTML views, PDF and ePub downloads, according to the available data) and Abstracts Views on Vision4Press platform.
Data correspond to usage on the plateform after 2015. The current usage metrics is available 48-96 hours after online publication and is updated daily on week days.
Initial download of the metrics may take a while.