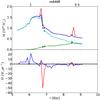
Fig. 14
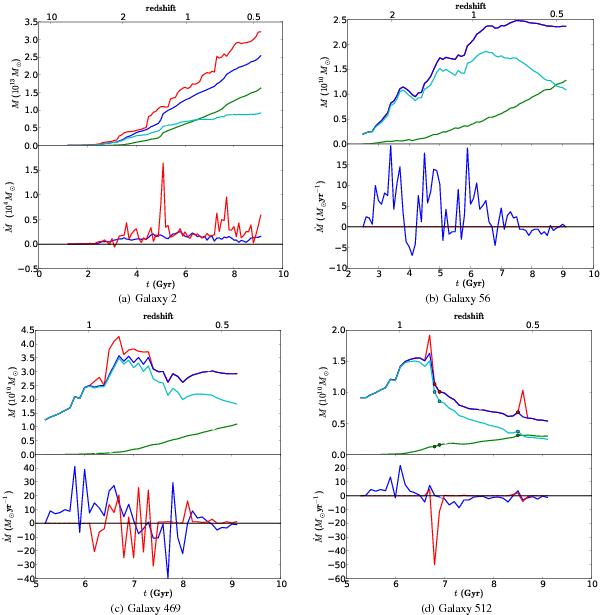
Top: mass history of four typical galaxies. Blue curves: baryonic mass of the galaxy. Red curves: baryonic mass of the galaxy plus its satellites. Green curve: stellar mass of the main galaxy. Cyan: gas mass. Bottom: mass origin, where red represents a merger from another (sub)structure and blue, smooth accretion from the background.
Current usage metrics show cumulative count of Article Views (full-text article views including HTML views, PDF and ePub downloads, according to the available data) and Abstracts Views on Vision4Press platform.
Data correspond to usage on the plateform after 2015. The current usage metrics is available 48-96 hours after online publication and is updated daily on week days.
Initial download of the metrics may take a while.