Fig. 13
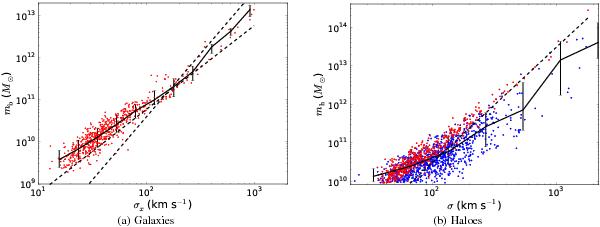
Mass versus velocity dispersion. Left: galaxies; right: haloes (red) and subhaloes (blue). The solid black line is the median of the baryonic (stellar plus gas) mass of galaxies (panel a)) and dark matter mass of haloes and subhaloes (panel b)) and the errorbars are the 15th and 85th percentiles. The dashed black line in the right panel shows the expected slope m ∝ σ3, and on the right panel, the lines show the slopes m ∝ σ3 and m ∝ σ2.
Current usage metrics show cumulative count of Article Views (full-text article views including HTML views, PDF and ePub downloads, according to the available data) and Abstracts Views on Vision4Press platform.
Data correspond to usage on the plateform after 2015. The current usage metrics is available 48-96 hours after online publication and is updated daily on week days.
Initial download of the metrics may take a while.