Fig. 3
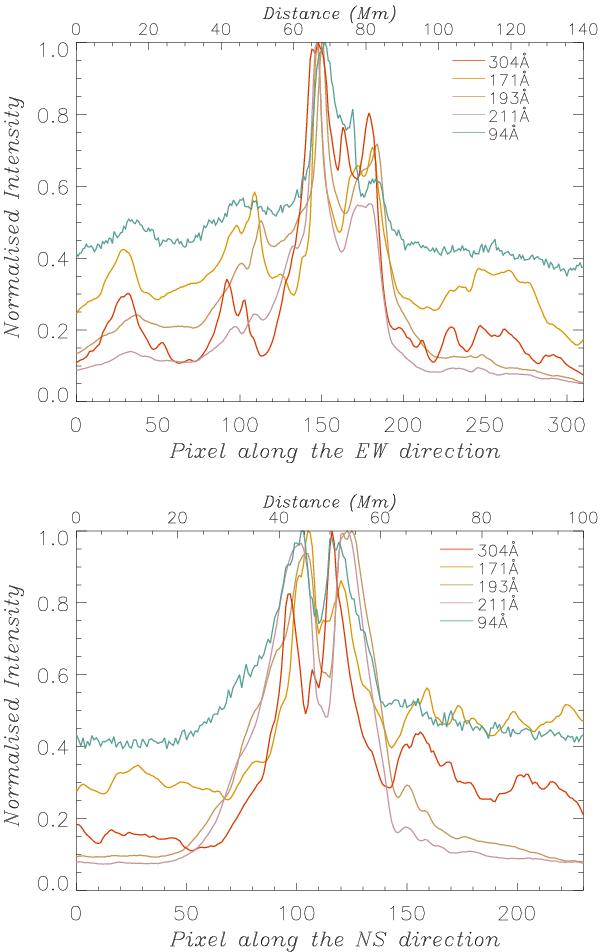
Intensity variation averaged over three hours (22:00 to 01:00 UT) for all five SDO/AIA channels: along the east-west direction at the NS location of –300′′ (top), and along the south-north direction at the initial EW location of –375′′ (bottom). The intensity is normalised to the maximum intensity for the sake of comparison.
Current usage metrics show cumulative count of Article Views (full-text article views including HTML views, PDF and ePub downloads, according to the available data) and Abstracts Views on Vision4Press platform.
Data correspond to usage on the plateform after 2015. The current usage metrics is available 48-96 hours after online publication and is updated daily on week days.
Initial download of the metrics may take a while.