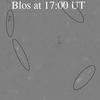
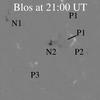
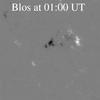
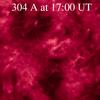
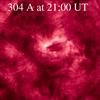
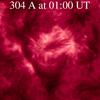
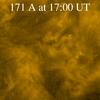
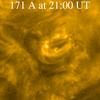
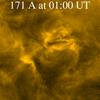
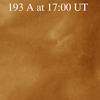
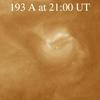
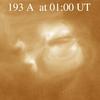
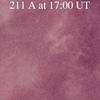
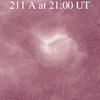
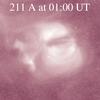
Fig. 1
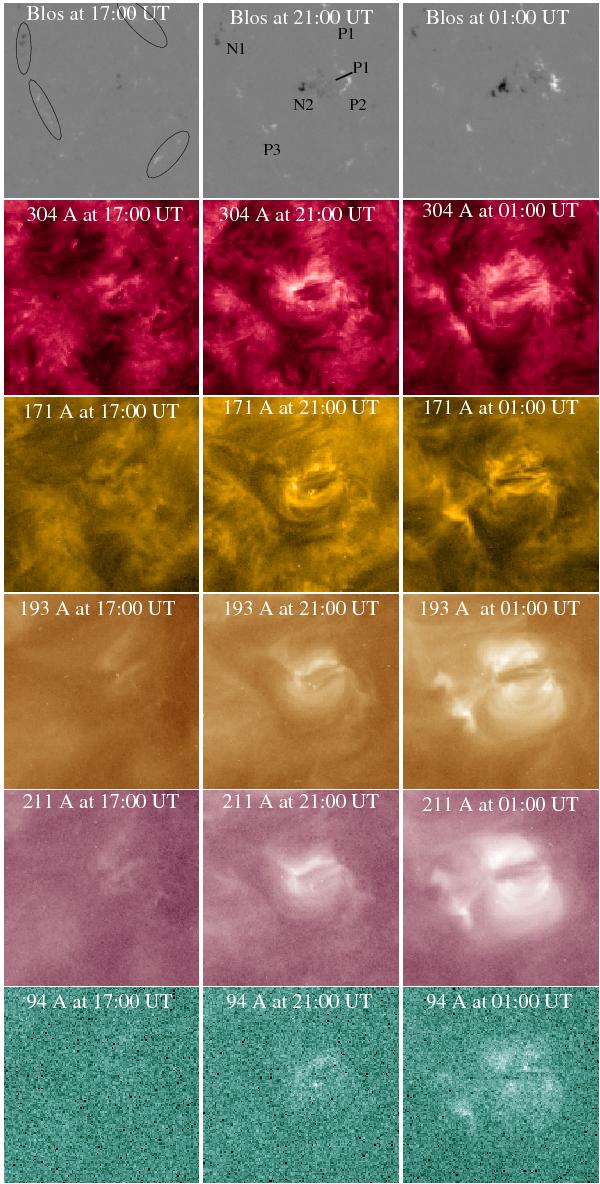
Time series of images showing the emergence of the active region at three different times during the eight hours: the line-of-sight magnetic field from SDO/HMI (top row) scaled between –800 G and 800 G, chromospheric and coronal response from SDO/AIA at 304 Å, 171 Å, 193 Å, 211 Å and 94 Å (from top to bottom). The field-of-view is 90′′ in both directions centred on (–370′′, –305′′) at 17:00 UT. See text for details. Movies of the time evolution of the emergence are provided as online material.
Current usage metrics show cumulative count of Article Views (full-text article views including HTML views, PDF and ePub downloads, according to the available data) and Abstracts Views on Vision4Press platform.
Data correspond to usage on the plateform after 2015. The current usage metrics is available 48-96 hours after online publication and is updated daily on week days.
Initial download of the metrics may take a while.