Free Access
Fig. 11
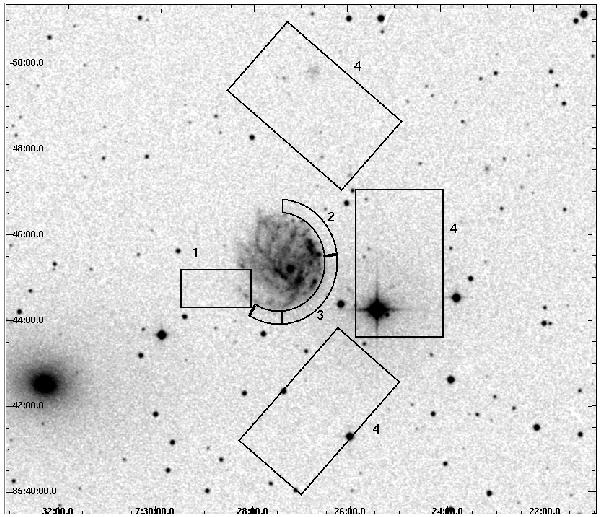
Regions of NGC 2276 for which the spectra were acquired overlaid on the DSS blue image. All background sources were excised before extracting each spectrum. The ends of the regions 2 and 3 are delineated with thin and thick lines, respectively. Three independent areas make up region 4.
Current usage metrics show cumulative count of Article Views (full-text article views including HTML views, PDF and ePub downloads, according to the available data) and Abstracts Views on Vision4Press platform.
Data correspond to usage on the plateform after 2015. The current usage metrics is available 48-96 hours after online publication and is updated daily on week days.
Initial download of the metrics may take a while.