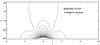
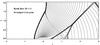
Fig. 4
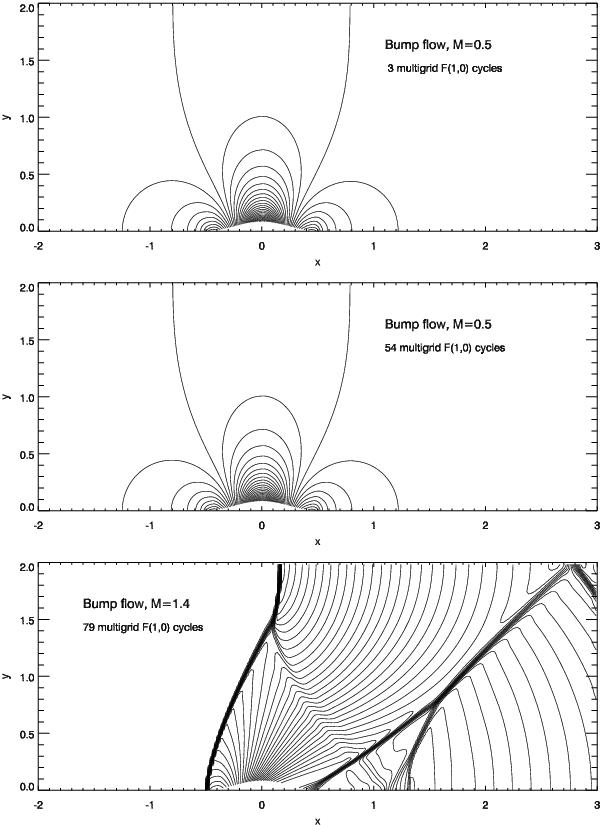
Pressure distributions of bump flow solutions on the 256 × 128 zone mesh using the standard scheme, MS3I/SGS. Fifty equidistantly spaced contours are shown between the pressure minimum and maximum. From top to bottom: a) M∞ = 0.5 case after only three multigrid F(1, 0) cycles, b) fully converged M∞ = 0.5 case (after 54 F(1, 0) cycles that reduced the defect by 12 orders of magnitude), and c) fully converged M∞ = 1.4 case.

Current usage metrics show cumulative count of Article Views (full-text article views including HTML views, PDF and ePub downloads, according to the available data) and Abstracts Views on Vision4Press platform.
Data correspond to usage on the plateform after 2015. The current usage metrics is available 48-96 hours after online publication and is updated daily on week days.
Initial download of the metrics may take a while.