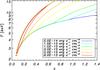
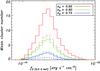
Fig. 5

X-ray characteristics of new EPCC clusters within [0.15−1.0] × r500. Left: contours of iso-flux in the XMM-Newton [0.5−2]-keV band plotted in the (z,T) plane. Right: X-ray flux distribution of new high-redshift (z ∈ [0.8−1] ) clusters for σ8 = 0.75 (blue), σ8 = 0.80 (green) and σ8 = 0.85 (red). The solid lines correspond to results obtained using the Jenkins et al. (2001) mass function while the dashed line was obtained using the Tinker et al. (2008) mass function.
Current usage metrics show cumulative count of Article Views (full-text article views including HTML views, PDF and ePub downloads, according to the available data) and Abstracts Views on Vision4Press platform.
Data correspond to usage on the plateform after 2015. The current usage metrics is available 48-96 hours after online publication and is updated daily on week days.
Initial download of the metrics may take a while.