Fig. 8
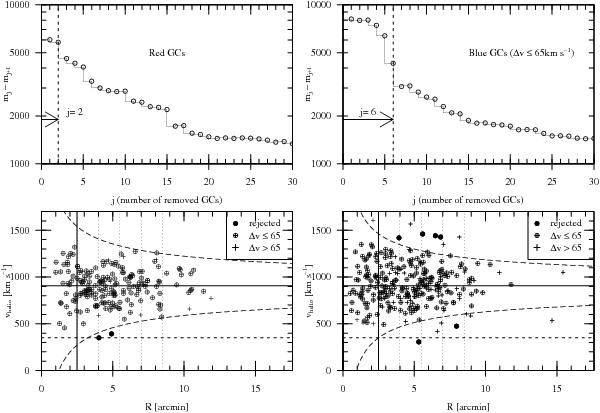
Outlier removal using the max(R·v2) algorithm. Left: all red GCs. In the upper panel, we plot the quantity (mj − mj + 1) against the index j. The number of removed GCs (j = 2) is indicated by the vertical dashed line and the arrow. In the lower sub-panel, we plot the heliocentric velocities vs. projected radius. Crosses mark GCs with velocity uncertainties Δv > 65 km s-1, and circles indicate GCs with Δv ≤ 65 km s-1. The rejected GCs are shown as dots. Right: the same algorithm applied to the Blue GCs with Δv ≤ 65 km s-1. Six GCs are rejected. In both lower sub-panels, the systemic velocity of NGC 4636 is indicated by a solid horizontal line. The vertical solid line at  indicates the radius inside which the photometry does not permit a separation of blue and red GCs. The dotted vertical lines show the bins used for the dispersion profiles shown in Fig. 12.
Current usage metrics show cumulative count of Article Views (full-text article views including HTML views, PDF and ePub downloads, according to the available data) and Abstracts Views on Vision4Press platform.
Data correspond to usage on the plateform after 2015. The current usage metrics is available 48-96 hours after online publication and is updated daily on week days.
Initial download of the metrics may take a while.