Fig. 6
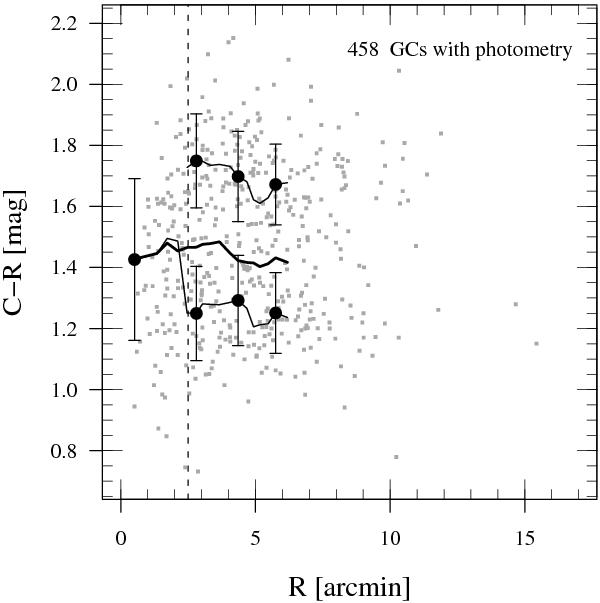
Colour distribution of the GCs as function of radius. The moving window contains 105 GCs, and the data points show the independent bins. The number of components to fit was determined by the mclust software. The “error-bars” give the widths of the respective distributions. The thick solid line shows the colour of the combined light of GCs within the sliding window. The vertical dashed line at  ( ≃ 13 kpc) indicates the galactocentric distance where the colour distribution becomes bimodal.
Current usage metrics show cumulative count of Article Views (full-text article views including HTML views, PDF and ePub downloads, according to the available data) and Abstracts Views on Vision4Press platform.
Data correspond to usage on the plateform after 2015. The current usage metrics is available 48-96 hours after online publication and is updated daily on week days.
Initial download of the metrics may take a while.