Fig. 5
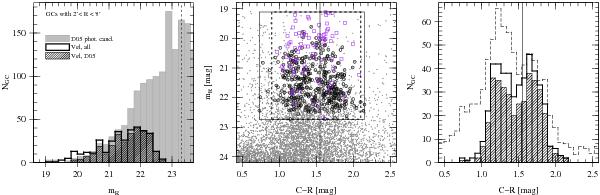
Photometric properties of the GC sample. Left: luminosity distribution of the GCs in the radial range 2′ < R < 8′ (indicated by the dashed lines in the middle panel of Fig. 4). The grey histogram shows the distribution of the GC candidates from the D+05 catalogue, the dashed bars are those D+05 GCs with velocity measurements. The unfilled histogram (thick black line) shows all GCs with 2′ < R < 8′ and Washington photometry and velocity measurements. The dashed line at mR = 23.33 mag indicates the turn-over magnitude (TOM) of the GC luminosity function (D+05). Middle: colour − magnitude diagram. Small dots are the point sources from the D+05 catalogue (only objects within the radial range covered by our spectroscopic GC sample are shown), and open symbols are GCs with velocity measurements: squares indicate those GCs with velocity measurements which are not in the D+05 list, circles are those identified in the D+05 catalogue. The solid line at shows the colour adopted to divide red from blue GCs. The solid rectangle shows the area occupied by the velocity confirmed GCs in this study, and the vertical dashed lines at 0.9 and 2.1 indicate the colour range adopted by D+05 to identify candidate GCs. Right: colour distribution. The unfilled dashed histogram plots the colour distribution of the D+05 candidate GCs with magnitudes and radial distances in the range of our velocity-confirmed GCs. No statistical background has been subtracted; for graphical convenience, the number counts have been scaled by a factor of 0.5. The thick solid line shows the distribution for all velocity-confirmed GCs with Washington photometry, and the dashed histogram shows the colours of the velocity-confirmed GCs with  (cf. Sect. 4.3 for details).
Current usage metrics show cumulative count of Article Views (full-text article views including HTML views, PDF and ePub downloads, according to the available data) and Abstracts Views on Vision4Press platform.
Data correspond to usage on the plateform after 2015. The current usage metrics is available 48-96 hours after online publication and is updated daily on week days.
Initial download of the metrics may take a while.